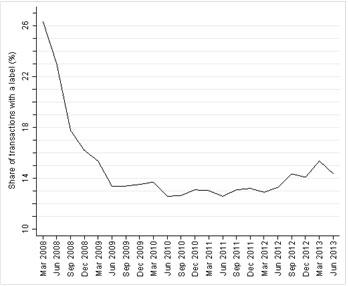
In the second quarter of 2013, 14.4% of NVM residential property transactions had an energy label. According to studies carried out by TIAS School for Business and Society, homes with this label required 100 fewer days for a transaction. In addition, homes sold with the 'green' label (A or B) yielded 3.8% more than those with an energy label between C and G.
Every quarter, researchers from TIAS examine how the energy label has performed within the owner-occupied property market in the Netherlands. Figure 1 indicates that the market share of 14.4% is equal to the average of the past two years. It appears that the energy label has now achieved a stable market share. "It is still remarkable to see that the majority of buyers attach little importance to the energy label. The information is valuable, after all, and the effects on the transaction can now be described as convincing" says Dirk Brounen, Professor of Real Estate Economics at TIAS and research coordinator within this analysis. Figure 2 clearly shows that the energy label is most popular in non-urban areas, and less popular in the large urban areas of the Amsterdam-Rotterdam-Utrecht conglomeration.
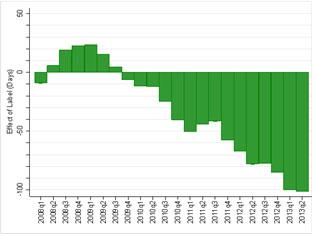
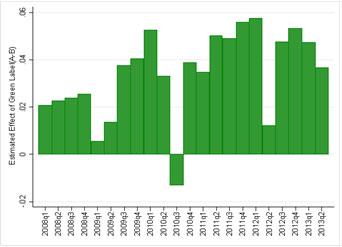
The effect of this energy label is also taken into account in an analysis of the sales results of transactions in the second quarter. This indicates that the presence of an energy label helps accelerate the sale by 100 days on average. Figure 3 reveals that this effect has been reinforced over the past few months. Potential buyers are evidently more and more appreciative of the additional information communicated on the energy label. This is also apparent when only the selling price is examined. Of the 2,406 label-related transactions in the previous quarter, homes with a green A or B logo energy label could expect a price premium of 3.8% on average, even when corrected according to the location and quality of the home in question. Since the introduction of the label, the popularity of this green label premium has been growing, as depicted in figure 4.
This quarterly analysis is carried out by researchers from the Real Estate LAB within TIAS, headed by Professor Dirk Brounen. They have access to the transaction data of the Dutch Association of Real Estate Brokers (NVM) and energy label information from the Dutch governmental organisation AgentschapNL. The price effects are examined extensively using a validated research model as described in "On the Economics of Energy Labels in the Housing Market" by Brounen and Kok and published in the Journal of Environmental Economics and Management 2011. This line of research into the effects of the energy label on the owner-occupied housing market in the Netherlands is continued via quarterly analyses.

Figure 1: market share of label transactions since 2008
Figure 2: market share of energy labels Q2 2013

Figure 3: impact of green energy label on time required to sell

Figure 4: impact of green energy label on selling price
Read more
Quarterly Report Q2 2013, Dirk Brounen (2013) - in Dutch